Two antenna diversity
Continuing my exploration of phase information and signal processing, I put up a temporary second antenna to feed my second receiver so that I could compare the signals in two spatially separated antennas. My primary antenna is a dipole about 25 feet off the ground, while this temporary antenna was a vertical end-fed Z with the top about 25 feet up in an apple tree. The spacing between the two antennas was about 60 feet.
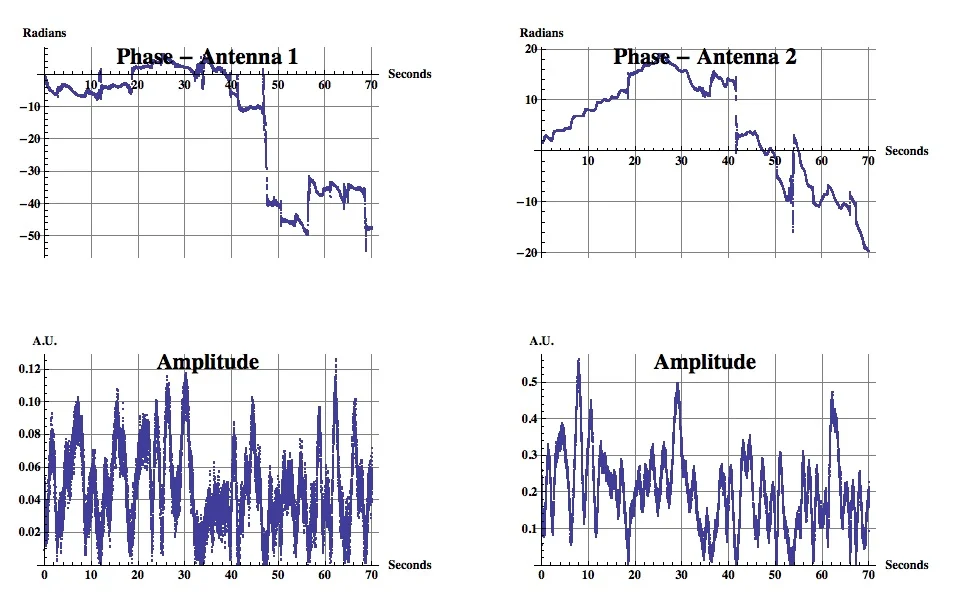
I again chose to analyze the WWV signal on 15 MHz, which at the time I took the data was fading in and out. As before I used my Flex-5000 receivers, digitized the two signals for a little over a minute and calculated their amplitude and phase. Here is the usual plot of the results:
Phase and amplitude of 15 MHz WWV with two spatially separated antennas.
Antenna 1 is the temporary vertical and antenna 2 is the dipole, which had a noticeably better signal; but both signals faded in and out. The phase plots don't look very pretty and that's because I've been using an unsophisticated phase unwrapping algorithm. Each digitized signal is composed of the I and Q components, and the phase angle is the inverse tangent of their ratio. However the inverse tangent is a multi-valued function which repeats every 2 pi, and the computed phase value always lies between -pi and +pi. If we assume that the phase is continuous, we can "unwrap" it when, for example it rises to pi and then immediately thereafter takes on the value of -pi as it wraps around. A general problem is that noise on the signal can make the unwrapping more difficult, particularly when the signal amplitude is very small and the noise contribution is very large. That's cause of the jumps in the phase in the above plots. I really need to write a better phase unwrapping algorithm, but as they say "this problem is a topic of current research" which means there isn't a known "best" algorithm. But I'll put that off to another day and continue the analysis with what I have, concentrating on the amplitude signal.
The idea of spatial diversity is that the signal path from the transmitter to the two antennas that are spatially separated is not identical and the hope is that when the signal is bad in one, it may be good in the other. How different the signals actually are depends on many things, not least of which is the physical separation of the two antennas. The general rule of thumb is that the spacing should be greater than a wavelength, and further is better. The wavelength for a 15 MHz signal is about 20 meters, so my 60 foot spacing is about a wavelength.
But there is also polarization diversity to be considered. The path taken by a signal through the ionosphere is affected by its polarization so even if two antennas occupy essentially the same spot but are sensitive to different polarizations, the signals they deliver can be quite different. In my case since I have a horizontal dipole and a vertical antenna I have polarization as well as spatial diversity.
In any case the question is whether the two signals exhibit the effects of this diversity. Its difficult to tell from the two separated plots above, so I'll plot them on the same graph, multiplying one by a constant value to make comparable overall amplitudes in the two signals:
Superimposed amplitudes of the two signals.
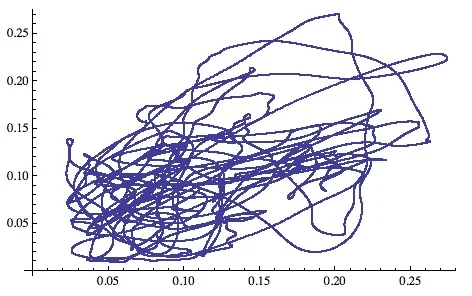
So they certainly don't display identical time dependences, but they don't look like they are totally independent either. Another way to visualize their co-dependence is to make an x-y plot of one signal versus the other at each point in time. If they were identical (but varying in time) then this display would look like a straight line inclined 45 degrees. Here is their actual trajectory:
Trajectory of one signal amplitude plotted versus the other.
This is pretty far from the straight line, so it does indeed look like the two signals are rather different.
The correlation coefficient is a more formal mathematical measure of how similar two signals are. There are many different variations on the correlation calculation, but when I apply a number of them to the above pair of signals, I get correlation values between 0.3 and 0.4, which indicates that they are moderately similar but not too much so.
I would like to do the correlation study with the phase as well as the amplitude, but I need to write a better phase unwrapping algorithm before that will be productive for signals that fade in and out like this.
This diversity has a practical application of course. If your receiver system has a way of evaluating the relative strength of the two signals and can switch quickly enough to choose the best signal at any given instant, then you should get a better combined signal. Notice that you can't just add the two signals - you really need to switch between them for the best results. Diversity in frequency, space and polarization are all used in some installations for which having the best signal is important enough to justify the cost and complexity of the setup.
And we are beginning to enter the territory of phased arrays - using the relative phasing of the multiple antennas to form beams that can determine what direction a signal is coming from, or null out an interfering signal. But this fascinating subject is a topic for another day.


